I’ve been looking at some OECD data on net savings by the corporate sector in six major economies. With the exception of France, the general pattern is one of a shift in the corporate sector from being a net borrower of capital from other sectors of the economy – to one in which the corporate sector is a net lender. Obviously within each country there will be large differences between the more successful companies and those which are struggling. But the overall pattern, especially in the period since the 2008 crisis, is that companies in the US, Japan, the UK, Germany and Italy have been building up cash piles at a rapid rate.

The situation in Japan is particularly startling. For the 12 years up to 2014 its corporate sector was piling up savings at the enormous rate of 5 to 8 per cent of GDP. But in the US the UK and Germany, from 2009 onward, net corporate savings were also large, at 1 to 3 per cent of GDP each year.
Commenting on this OECD data in the Financial Times, Martin Wolf wrote.
In a dynamic economy, one would expect corporations in aggregate to use the excess savings of other sectors, notably households – thereby generating both buoyant demand and growing supply. If investment is weak and profits are strong, however, the corporate sector will, weirdly, become a net financier of the economy.
For most companies, the money is kept available as a cash reserve, and is lent out on the short-term money markets. Notoriously, the larger companies now channel much of their reserve money capital through subsidiaries based in tax havens. But of course the money does not just sit in places like Bermuda, Luxemburg or Ireland. After tax sanitisation, it is transferred back to be lent out in big financial centres such as New York, London or Tokyo.
Here we are looking at one of the key mechanisms which is causing lack of growth in output and productivity – the much discussed pattern of relative stagnation in the advanced countries.
An increase in corporate reserves suggests that either profits are rising, or investment is falling – or some combination of both. A number of influential Marxists argue that it is basically because profits have fallen that investment is stagnant. Thus the reserve cash pile-up is happening because though investment is low, profits are even lower still.
This view is not correct. To take the US example, investment has not been rising by much in recent years, but neither has it collapsed. For example total investment in equipment by the non-financial companies was $246bn in 2010, and by 2015 was 45 per cent higher at $358bn in 2015. (In nominal terms. Source: BEA Fixed Assets, Table 4.7, line 39.)
In the US profits have certainly fallen in the 12 months to mid-2016 – but 2015 profits were 84 per cent higher than the 2008 level. After 2009, US profits recovered rapidly to reach over 5 per cent of GDP, and stayed above 5 per cent up to and including 2015, despite the slowing in that year.

In the US at least, profits were rising faster than investment in the years covered by the OECD data above. Thus, net savings have risen because investment has lagged the increase in profits
However there are further puzzles – the size of corporate reserves has risen despite continued rapid increase in executive salaries, and large handouts to shareholders. There is clear evidence that companies have been taking advantage of ultra-low interest rates, to borrow and pass the money on to their shareholders.
Profitability has recently taken a hit in a number of sectors, such as oil production, energy and shipping. But overall, the evidence in Table 1 indicates that, apart from in France, the total amount of debt being held by companies in the other five economies has recently been in decline.
Table 1. Core Debt of Non-Financial Companies as % GDP
| Debt in Q1 2015 as % GDP | Change since 2009 as % GDP | |
| United States | 69 | -1 |
| Japan | 104 | -6 |
| UK | 74 | -21 |
| Germany | 55 | -3 |
| Italy | 78 | -3 |
| France | 126 | +14 |
Source: BIS Quarterly Report, September 2015, Table F4.1.
There are big national differences in the debt/equity split, and thus in overall corporate debt levels. But between 2007 and 2014, company debt declined in Japan, Italy, the US and Germany, and by a large margin, in the UK.
It is the case that, with the exception of Japan, companies, in aggregate, have maintained quite impressive levels of dividend payments. In the US and Europe there have been large programmes of share repurchase. The City analyst, Andrew Smithers, notes that in the US, for example, since 2009, companies have been net buyers of equity at an average rate of 2 per cent of GDP a year.
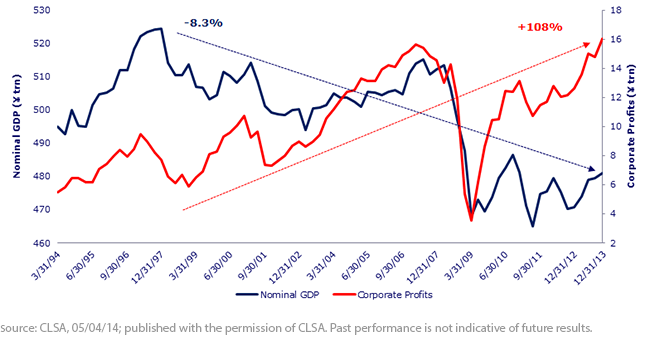
Japan has been in a deep state of stagnation in investment and output. But this is not because profits have been low. The data below show that profits recovered rapidly from the collapse of 2008 to return to pre-crash levels. Only in the last 2 years have profits declined in Japan. But growth has remained in the doldrums throughout the post 2008 period. The trend lines in the figure show that since the late 1990s, profits have rise by 108 per cent and GDP has fallen by over 8 per cent.
In Japan companies have been exceptionally cash retentive. This is in part because shareholder activism has so far been quite limited, though the present government is trying to encourage shareholders to be more aggressive and put corporations under pressure either to invest their spare capital productively, or allow it to be returned to shareholders. What is certainly the case in Japan is that the relatively low investment levels are not due to lack of profitability in the central core of heavyweight companies.
A further reason why build-up of corporate cash reserve has been so unusually rapid in Japan, is that much recent investment by Japanese industrial companies has taken place in low-wage, low-cost locations, in China especially, but also throughout South East Asia. The real level of Japanese industrial investment has been quite high, but not as measured in Yen. Smithers in the article quoted above reports that foreign direct investment by Japanese companies was nearly 6 per cent of GDP in 2013.
Elsewhere in the US and Europe the maintenance of a high share price has become a central objective of corporate strategy. The rise of shareholder value has effected a deep shift in the mode of corporate regulation, away from the pre-1990s system in which managerial strategies were more focused on the long-term growth of the company and prioritised the ploughing back of capital into productive capacity.
The advent of shareholder regulation does not mean a reduction in control by executives. Rather powerful incentives are now used to draw executives into giving priority to high share price targets. Large bonuses are linked to the share price, and often take the direct form of stock option handouts.
Shareholder value does not mean that pressures for high profitability are anything but unrelenting. Profit levels provide the capital needed to keep share prices high by financing lavish dividend handouts and share buyback strategies. But the effect of targeting high share valuations, is that companies are cautious about investing in an expansion of capacity unless there seems to be a fairly secure prospect of getting a substantial rate of return.
Michael Roberts noted recently a report from the US Fed of research which found that CEOs of a non-financial companies insist on an average expected profit rate of 14 per cent before they decide on a new investment project. For large companies (above $100 million in annual sales) the profit hurdle rate was even higher, at 15 per cent. As the Fed study emphasises, it is striking that these hurdle rates on new investment have not been reduced since the 1990s despite the enormous drop in the cost of capital after around 2000, as interest rates tumbled. In real terms, the required hurdle rate on new investment has risen sharply as interest rates have fallen.
That such demanding rates can be maintained is of course testimony to the impressive average rates of profit which the average US company has been able to achieve in recent years. Companies are cautious about investing in projects which are judged to produce a lower rate of profit than is already being attained. Available money capital is used to try to enhance profitability in other ways than in the direct expansion of productive capacity. Notably in three ways.
- Profits are used to finance the costs of downsizing, rationalisation, and the elimination of less profitable capacity.
- Mergers and acquisition activity continues at a high rate in the US and Europe, as companies play the market in corporate control to increase their competitive capacity via economies of scale, monopolisation, and increased market share. Takeover strategies require, above all, a large war-chest of available cash reserves. So also do operations to resist and defeat hostile takeovers. The building of financial firepower for the M&A battlefield is a major motivation behind the current drive to accumulate cash piles.
- Evasion of corporate profit tax which is levied at over 20 per cent in most of the high income economies, and, famously, at 35 per cent in the US. Profits from productive investment are more difficult to shelter from taxation, as compared with the financial engineering of cash piles being shifted around between tax havens.
So what we see in the high-income economies is the following: quite high profits, a lag in investment, and – despite generous handouts to shareholders, and lavish executive salaries and stock options – the continuing build-up of large corporate cash reserves.
It is important to note that this pattern, though it has been reinforced since the 2008 crisis, was nevertheless well established in the US and Europe in the years before the crisis. Indeed it played a part in the causation of the crisis. Corporate cash reserves have been one of the sources of a general surplus of money capital in the post-2000 period. This surplus was transferred to the financial system to be lent-out or invested. Under pressure to find borrowers for large inflows of large quantities of surplus capital, and greedy for the potential profits to be made, the banks dropped their prudential standards and engaged in a bonanza of high risk lending. This included, in the US, large scale mortgage lending to households not in a position to maintain repayments. For the Northern European banks, the financing of unsustainable booms in housing and commercial property in the peripheral countries of Europe.
Since 2008 the pressures of surplus capital have remained strong, but have morphed into other forms. Notably the present acute dependence of the financial system on central bank purchases of bonds on a mammoth scale. Also the testing to dangerous limits of the capacity of the emerging economies to provide a sufficient supply of safe and profitable investment and lending opportunities.
The profit-investment gap in the advanced economies remains one of the major sources of a worldwide excess of what Marx called interest-bearing capital. Central to the current stagnation in growth is the disproportionality between the levels of profits being generated by the system, and its more limited capacity to absorb available capital productively.
I shall return to these themes when I get back from holiday in two weeks time.
