At the Historical Materialism conference in London on 14 November there was a session, organized by Al Campbell, on the Marxist debate about the 2007-09 crisis and since – with papers by Michael Roberts, Al and myself. I posted an extended version of my paper in which I argued that a global surplus of money capital was a crucial underlying factor in the crisis, and criticised Michael’s falling rate of profit explanation. Michael made a strong defence of his position in his post of 12 November. However I believe that his case is flawed and that some of the evidence he has presented supports my reading of the crisis rather than his.
We are in agreement that underlying the 2007-9 crisis in the US were the conflicting forces which determine the rate of profit, as explained in Marxist theory. Michael argues that the empirical evidence, backed by theoretical analysis, indicates that it is the tendency for the rate of profit to fall which has been the decisive trend. I consider that the empirical evidence shows that it is the profit-raising countertendencies which have been dominant since the start of the neoliberal period in the early 1980s.
Michael believes that it was an actual fall in the rate of profit in the US after 1997 which was the crucial factor underlying the financial crisis in 2007-9. I argue that the rate of profit in the US, and in some other large economies (plus also the rate of surplus-value) has been tending upwards from the late 1990s, through to 2015, though with cyclical downturns around 2000 and 2008. This surge in profits, in combination with a sizable lag in investment, contributed to a global surplus of capital (in the money form) which the financial system has found great difficulty in on-lending or investing safely.
In the US the financial crisis of 2008 happened because more than $1 trillion of money capital had been lent out by the banks in high-risk subprime mortgages. Default on these mortgages, and on the vast number of securities based on those mortgages which the banks had created, was the central immediate cause of the 2nd phase of the crisis – which went critical when Lehman folded in the autumn of 2008. But the 1st phase of the crisis had started to unfold early in 2007 as the crash in house prices led to a steep fall in consumer demand.
Using Michael’s own data, I showed that the US corporate profit rate did not, as he had argued, ‘reach a peak in 1997, which has not been since surpassed’. Figure 1 summarises the results I reported.

As Figure 1 shows, the rate of profit was just under 27 per cent in 1997, but after a dip during the dotcom crisis of 2000-1, recovered strongly to reach 27 per cent in 2005, and 29 per cent in 2006. Also there was a rapid recovery starting in 2010: in 2012 and the two following years the corporate rate of profit hovered around 27 per cent.
Michael in his reply did not question my data in Figure 1. But he suggested that his argument would still stand if we looked not at annual data but at the quarterly breakdown of profits which the Fed publishes. And we should look specifically at the non-financial industrial sector and not, as in Figure 1, at the whole corporate sector (which includes banks and other financial companies). Michael writes:
Annual figures from the rate of profit are not very helpful on the timing here. In my original work which Jim is quoting from, I also used the quarterly figures provided by the US Federal Reserve. The Fed data can give us the non-financial corporate sector rate of profit by the quarter. According to that data the US NFC rate of profit started falling in Q3-2006. Indeed by the time of the credit crunch in mid-2007 (before the start of the Great Recession) the NFC rate of profit had fallen 20 per cent.
Before looking at the quarterly data, as Michael recommends, I should mention that he and I are also in dispute about the trend of profits since the crisis period of 2007-9. Michael had said, as I noted above, that the US rate of profit ‘reached a peak in 1997, which has not been since surpassed’. But, as Figure 1 indicates, the 1997 peak was under 27 per cent, and the profit rate made a rapid and sustained recovery from a low of 22 per cent in 2009 to slightly higher than 27 per cent in 2012 and 2014. Michael suggests that, ‘if we look at the Fed’s quarterly data for the non-financial sector we find that the [post-crisis] peak was as early as Q3 2010 and is now [2016] some 20 per cent below that peak’.
I have recalculated profit trends for the non-financial sector from 2002, using the same Federal Reserve quarterly data on which Michael bases his conclusions. Figure 2 summarises my results and they do not support his case.

[Note that rates in Figure 2 cannot be directly compared with those in Figure 1 as the definitions which Michael Roberts uses are quite different. But trends within each Table are consistent. For a clear explanation of the quarterly Fed data which Michael recommends, and which I have tracked in Figure 2 – see a paper by the Swedish researcher Anders Axelsson
There was no appreciable fall in the non-financial rate of profit in 2006. There was a drop in Q1 of 2007, but a recovery in Q2. Only from Q3 was there a fall through until the beginning of 2009, though with a mini recovery in the middle of 2008. It is really not plausible that these not very sizeable variations in profit rates can have played much direct role in the economic cataclysms of this period. Also, though it is useful to look at quarterly rates, we have to recognize that profit estimates in any given quarter can be distorted by variations in the timing of profit declarations.
It is the case that the rate reached a temporary peak in Q3 of 1997 of 9.6 per cent. It is true that this was not surpassed in the recovery of 2005 and 2006, but did reach 9.8 per cent in Q3 of 2010. The average rate in the 4 quarters of 1997 was 9.3 per cent – but 9.5 in 2010.
Apart from a glitch in Q1 of 2011, a rate of profit of over 9 per cent was maintained right through to the start of 2013. A definite downward trend began in mid-2014 and continued until nearly the end of 2016. Since Figure 2 was prepared, it has been reported that in Q3 of 2016 there was a small recovery in the rate of profit, from 7.1 to 7.4 per cent. It in possible that this is the start of a more sustained upswing. The financial markets certainly think it is, and equity prices have soared, especially since the advent of Trump.
Could the quite sharp fall in the profit rates of non-financial companies in the Q2 and Q3 of 2007 be in any way responsible for initiating the financial crisis that began to unfold in the autumn of 2007? In Michael’s view the mechanism involved would be that non-financial companies respond to a fall in the average rate (and mass) of profit by cutting investment, which in turn leads to reductions in employment, wages and consumer demand. He writes:
I have argued ad nauseam that it is the profitability of the capitalist sector of economies that is the driver of investment and thus employment and incomes. A sustained fall in profitability and in the mass of profits will eventually lead to a fall in investment after a year or so and then deliver a slump in the productive sectors of a capitalist economy, triggering in turn, a financial (credit) crisis.
The difficulty with this line of argument is that there is simply not enough time for such a causal sequence to take effect in 2007-8 – and Michael only claims here that the reaction of investment to a fall in profits will only happen ‘eventually’. As I show below unemployment was rising sharply from the start of 2008.
In any case the factual evidence about investment in this period does not support his analysis. Figure 3 shows how investment levels evolved between 1998 and 2015 (annual data only, quarterly figures are not available).

What Figure 3 shows is that in the recovery from the downturn of 2000-1, investment climbed steeply right through until 2007, rising by 45 per cent, from $900 billion to $1.3 trillion. Even in 2008 investment was slightly higher than in the previous year. Not until 2009 did investment fall, and it then quickly rose once again from 2010 through to 2015. To control for the effects of inflation and of growth, in Figure 4 the same data for investment in fixed assets by non-financial companies are shown as a percentage of GDP.
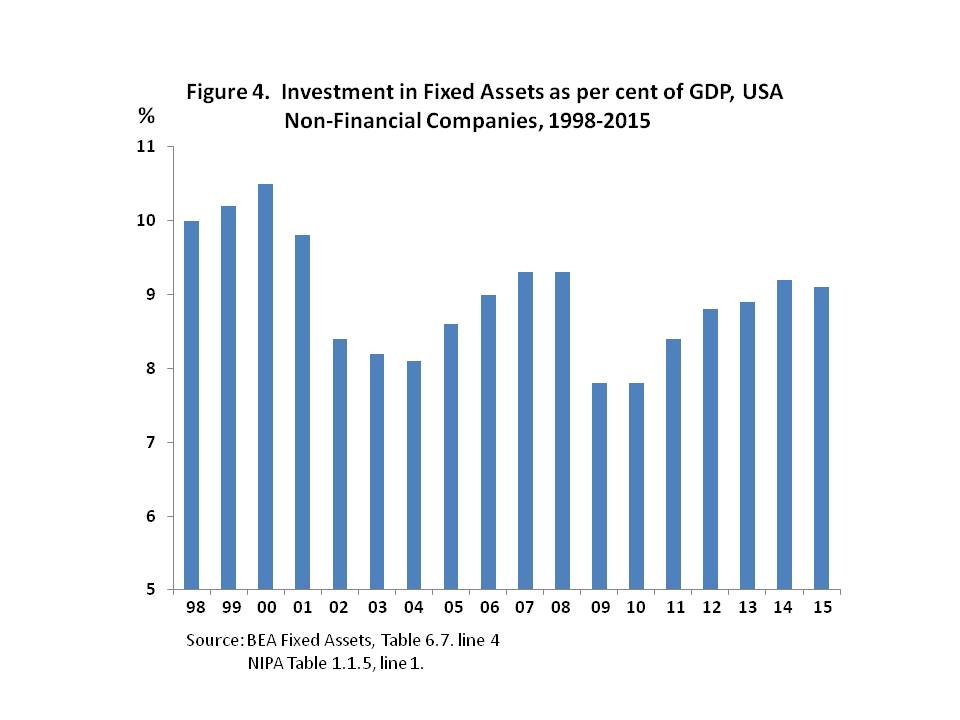
Figure 4 shows the exceptionally high investment levels in the late 1990s in the lead-up to the dotcom crisis of 2000-2, generally recognised as having been caused by over-investment. But, again, there no evidence that a fall in average investment was one of the causes of the 2007-9 crisis. Investment climbed from 2004 through to 2007, and levelled out in 2008. The fall came in 2009.
We can be confident that the fall in the rate of profit and investment by non-financial companies which eventually came in 2009 did play a part in deepening and generalising the crisis in its later stages. But the evidence suggests that until 2009 US the non-financial rate of profit could not have been in any sense a direct cause of the US financial crisis which started in a rather mild form in the autumn of 2007, became more serious when Bear Stearns had to be rescued in March 2008, but did not become critical till mid-September 2008 when Lehman Brothers collapsed and major banks had to be saved by state intervention.
But as Figure 5 shows, large numbers of jobs were being lost right from the start of 2008, though with a huge acceleration after September. But if falling investment is the mechanism which translates a decline in profits into a rise in unemployment – then it cannot be a lower rate (or mass) of profits which caused the loss of jobs in 2008. As I have noted, it is true that profits were lowish in 3 of the 4 quarters in 2007. The crucial point however is that, investment was rising in 2007, then again in 2008 and only started to fall in 2009.
In my next post I will argue that the 2007-9 crisis in the US had two phases. (1) A collapse in house prices which started early in 2007 and led to a sharp contraction in consumer demand, as households reacted by cutting back on borrowing and began to repay debt. (2) A separate, though connected, crisis in the banking system which did not have a major impact on productive economy until the autumn of 2008.
Figure 5 was published in the Economic Report of the President 2010, p. 28.

Figure 1 – Definitions and Sources:
Profit = Net Gross Value Added MINUS Annual Depreciation MINUS Employee Compensation.
Corporate sector (Financial and Non-Financial Companies, Domestic Economy only).
GVA Domestic Corporate Business – BEA Table 1.14. line 1.
Employee compensation – BEA NIPA Table 1.14, line 4.
Fixed asset annual depreciation (historical cost) – BEA Fixed Assets Table 4.6, line 17.
